
Being able to determine diastolic dysfunction of the left ventricle (left-sided filling pressure) in your patients can help you:
- Assess the fluid status of your patients
- Optimize diuretic management of Diastolic Congestive Heart Failure (HFpEF)
- Differentiate between cardiogenic and non-cardiogenic pulmonary edema aka acute respiratory distress syndrome (ARDS)
However, self-learning how to measure and interpret diastolic dysfunction using echocardiography may seem difficult, intimidating, and confusing.
The main barriers I have seen for people to learn how to perform diastolic dysfunction measurements are:
- Using Pulse Wave and Tissue Doppler seems too advanced
- There seems to be too many measurements that have to be performed
- Interpreting the diastolic waveforms seem difficult
I felt like it was difficult when I first started as well. Just look at what the American Society of Echocardiography (ASE) guidelines on what you should measure: mitral inflow, tissue Doppler, pulmonic vein flow, tricuspid regurgitation velocity, deceleration time, isometric volumetric time, and more. Gasp.. that’s a lot!
I mean, do you really need to know all of this just to figure out the diastolic dysfunction of your patient? And you’re also probably wondering what measurements actually matter the most and are the easiest to learn/acquire?
Well, the good news is that the majority of the time, you only really need to learn how to do TWO measurements: Mitral Inflow and Tissue Doppler measurements. Yes, that’s it!
Lanspa et al, showed by just measuring those two things in the ICU they were able to find differentiate between the different stages of diastolic dysfunction with about 90% accuracy compared to the comprehensive ASE method.
In this post, you will learn
- The fundamentals of how Pulse Wave and Tissue Doppler work
- How to obtain Mitral Inflow and Tissue Doppler measurements for Diastolic Dysfunction.
- How to actually UNDERSTAND Diastology using a simple “PUSH and PULL” Concept
- How to determine the Grade of Diastolic Dysfunction your patient has.
- How to practically USE Diastolic Dysfunction measurements in your patients
Don’t try to memorize all this stuff. The approach I will show you will help you understand why the waveforms appear the way they do. So in the future, you will be able to derive these waveforms from scratch.
In addition, I made Diastolic Dysfunction PDF Pocket Card you can download, as well as a Diastolic Dysfunction Calculator that will help you determine the diastolic dysfunction of your patients.
Disclaimer: Just reiterating, I’m not going over all of the diastology parameters in this post. Just the two highest yield measurements (mitral inflow and tissue Doppler). If you want to learn more about all of the other measurements I suggest you read the full ASE article.
Alright lets get to it!
Table of Contents
Diastolic Dysfunction POCKET CARD PDF (Downloadable)
Like this Post?
Sign Up For POCUS 101 Updates!

Diastolic Dysfunction Echo Calculator
Here is an easy to use Calculator I made for you to get the diastolic dysfunction calculations you need. It can also calculate an estimated Left Ventricular End Diastolic Pressure/Pulmonary Capillary Wedge Pressure (LVEDP and PCWP) for you!
How to Think about Diastolic Dysfunction – Just TWO Things!
Interpreting diastolic dysfunction may seem difficult at first. But it’s actually really simple if you just focus on TWO concepts.
- How does blood flow into the left ventricle during diastole?
- How does the muscle of the left ventricle relax during diastole?
That’s all you really need to know. Once you understand these, you can derive all of the diastolic ultrasound measurements we will go over in this post.
Just think to yourself, as the left ventricle gets stiffer (less compliant), how will that affect left ventricular blood flow and relaxation? It’s as easy as that and we’ll look at all of the diastolic dysfunction patterns from that point of view in this post.
Before we look at all of the diastolic dysfunction waveforms though, you will need to be able to acquire an apical 4-chamber view using echocardiography and a basic understanding of how Doppler works.
Machine and Patient Preparation for Exam
- Ideally, place the machine on the patient’s right side so you can scan with your right hand and manipulate ultrasound buttons with your left hand.
- Transducer: Phased Array Probe
- Preset: Cardiac
- The Indicator should be on the RIGHT side of the screen (cardiac mode)
- You must have Pulse Wave Doppler and Tissue Doppler capability on your ultrasound system. Most cart-based systems have this, but unfortunately, most hand-held ultrasounds don’t have Pulse Wave Doppler or Tissue Doppler.
- Place patient supine or left lateral decubitus position
- Acquire the apical 4-chamber view of the heart. Click HERE to see a video on how to do this.
Understanding Pulse Wave Doppler and Tissue Doppler
In order to measure blood flow into the left ventricle or how well the left ventricular muscle is relaxing, we will be using the Doppler function of the ultrasound machine. Unfortunately, without understanding how Doppler works, there is no way you can measure diastolic dysfunction.
To keep it simple, Doppler just measures the speed of blood flow or speed of tissue movement either towards or away from your ultrasound probe. ALL of the Doppler modes do this, whether it is color Doppler, pulse wave Doppler, continuous wave Doppler, or tissue Doppler. The concepts are all the same.
Let’s briefly go over the two Doppler functions you will be using to measure diastolic dysfunction: Pulse Wave Doppler and Tissue Doppler.
Using PULSE WAVE DOPPLER to Measure BLOOD FLOW
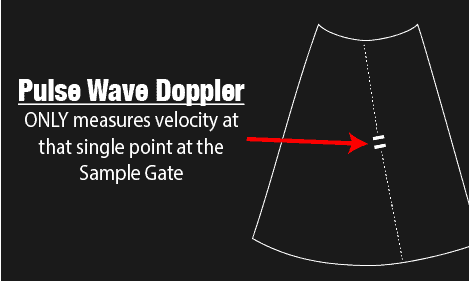
Pulse Wave Doppler allows you to measure the velocity of blood flow (at a single point) as it enters the left ventricle. You must have an ultrasound device that is capable of performing Pulse Wave Doppler.
Pulse Wave Doppler Sample Gate
A unique aspect of Pulse Wave Doppler is that you can specify to the ultrasound machine exactly where you would like the machine to measure the velocity using the Sample Gate. It’s usually seen by two horizontal lines along your cursor. you can move your cursor and your sample gate and place it exactly where you want to measure your blood velocity.
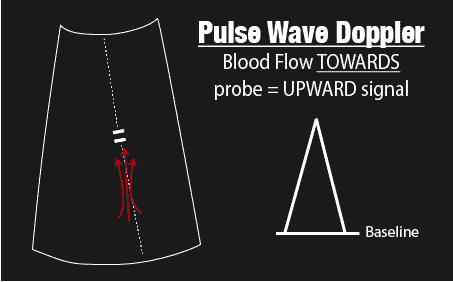
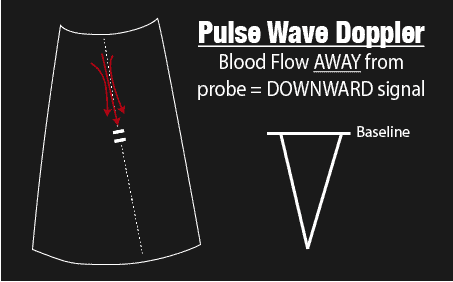
So if blood flows TOWARDS your sample gate you will get a positive deflection above the baseline, and if blood flows away from your sample gate you will get a negative deflection. It is important to understand which way blood is flowing since this will affect where you will place your baseline.
Pulse Wave Baseline and Scale
In this post, you will be using Pulse Wave Doppler to measure the inflow of blood into the left ventricle at the mitral leaflet tips (apical 4-chamber view). Since blood is flowing from the left atrium into the left ventricle it will be going TOWARDS the probe and there will be an UPWARD deflection of the Pulse Wave Doppler signal. This will result in the E and A waves (we will go over what these waves are in the Normal – Grade 0 Pattern below).
You will also need to optimize the baseline and scale of your pulse wave Doppler settings to best capture accurate mitral inflow signals. You can do this by bringing your baseline towards the bottom of the screen and setting the scale to about 100-120cm/s. Now you can start measuring the Mitral Inflow velocities to assess diastolic dysfunction of your patients using Pulse Wave Doppler!

Using TISSUE DOPPLER to Measure LV MUSCLE MOVEMENT
Now let’s go over how to use Tissue Doppler to assess Diastolic Dysfunction.
The good news is that all of the principles of Pulse Wave Doppler also apply to Tissue Doppler. In fact, Tissue Doppler is just another form of Pulse Wave Doppler that allows you to measure the much slower speeds of tissue/muscle movement (from 1cm/s – 20cm/s) compared to Pulse Wave Doppler that measures the much faster speed of blood (30cm/s – 200cm/s).
For Diastolic Dysfunction, we will be using Tissue Doppler to specifically measure the speed of left ventricular muscle relaxation during diastole. This will allow you to see how “stiff” the left ventricle is. A normal heart will relax quickly during diastole and a stiff heart will have a slower speed of muscle relaxation.
Accessing the Tissue Doppler function will vary by machine but usually just involves pushing a button labeled “TDI” (Tissue Doppler Imaging) while you are in the Pulse Wave Doppler mode.
Which Direction Does the Muscle of the Left Ventricle Move During Diastole?
This sounds like a simple question, but it confuses many learners. The direction of diastolic left ventricular movement (at the mitral annulus) is actually away from the probe as it expands to allow blood to fill the left ventricle. This is why you will get an upward signal with your mitral inflow (blood flowing towards the probe) and a downward signal when measuring muscle movement of the left ventricle using Tissue Doppler (muscle moving away from the probe).

Setting the Tissue Doppler Sample Gate, Baseline, and Scale
The two validated areas where you can place the Tissue Doppler sample gate are at the septal or lateral portions of the mitral annulus. In this post we will use the septal annulus since it is usually easier to obtain and not obscured by lung parenchyma like the lateral annulus may be.
For the tissue Doppler baseline, bring it up towards the top of the screen since you are looking for a negative deflection. Lastly set the scale to around -15 cm/s (muscle has lower velocity).

Learn How to Get Tissue Doppler e’ Measurements in < 60 seconds!
Made this quick diastolic dysfunction video for you on how to get Tissue Doppler e’ measurements in the septal and lateral annulus:
Like this Post?
Sign Up For POCUS 101 Updates!

The Push and Pull Phenomenon of Early Diastolic Filling (the E wave)
Before we go into all of the diastolic dysfunction patterns, I want to show you something that I’ve really seen help learners understand the most confusing part of diastology: interpreting the E wave (early filling) of the mitral inflow velocities. If you try to memorize normal, impaired relaxation, pseudonormal, and restrictive patterns it can become super confusing! Especially when trying to figure out normal versus pseudonormal patterns.
POCUS 101 TIP: Just think of the blood flowing into the left ventricle during early diastolic filling (E wave) as primarily being “Passively PULLED” in from Left Ventricle Relaxation OR being “Actively PUSHED” in because of increased left atrial pressure. This will allow you to understand why the E waves appear they do for all the grades of Diastolic Dysfunction.

Now let’s get to interpreting all of the different grades of Diastolic Dysfunction! You may want to download and reference the summary PDF while going through this as well.
Grade 0 – Normal Diastolic Function
Grade 0 (normal diastolic function) is seen in healthy hearts, where most of the blood flow into the left ventricle occurs during early diastolic filling from the passive “PULL” of the left ventricle as it relaxes and expands.
With that in mind, let’s go over the Doppler patterns.
Mitral Inflow Pattern for Grade 0 Normal Diastolic Function
There are two mitral inflow waves that represent blood flow coming into the left ventricle. The first is the E wave (early diastolic filing) and the second is the A wave (atrial kick). You just have to remember that capital E and A represent mitral inflow patterns using Pulse Wave Doppler.
Grade 0: Normal Mitral Inflow
- E wave: majority of blood flow resulting from Passive PULL of left ventricle relaxation (large E wave)
- A wave: Atrial kick with small amount of Blood Flow (small A wave)
- E/A > 0.8

Tissue Doppler Pattern for Grade 0 Normal Diastolic Function
There are also two Tissue Doppler waves and they are e’ wave (early diastolic filing) and a’ wave (atrial kick). They are referred to as “e prime” and “a prime.” Luckily, only the e’ wave is commonly needed to assess for diastolic dysfunction. Recall that we will be using the SEPTAL e’ and it’s corresponding values for this post.
Since the myocardium of the left ventricle is relaxing normally, you will expect it to relax/expand quickly, hence the e’ velocity on Tissue Doppler will be relatively quick (compared to someone with abnormal diastolic function) and you will expect a large negative deflection of the e’ wave (> 8cm/s for septal e’). (Editor’s note: Technically it would be -8cm/s since it is a negative deflection but e’ is commonly referred to in absolute values. Also, this is assuming you use the septal e’. If you use the lateral annulus e’ the normal value is > 10 cm/s)
Grade 0: Tissue Doppler
- Normal LV muscle relaxation
- e’ > 8cm/s (septal annulus)

E/e’ Ratio for Grade 0 Normal Diastolic Function
The E/e’ ratio has been found to be fairly sensitive in evaluating the degree of diastolic dysfunction. The LOWER the ratio the better the diastolic function. This makes sense since the ratio is inversely proportional to the e’. So the higher the e’ (better diastolic function/muscle relaxation) the lower E/e’ ratio.
A patient with Grade 0 Diastolic Function should have an E/e’ ratio < 8.
Summary: Pattern for Grade 0 Diastolic Dysfunction (Normal)
In summary what you should see for Grade 0 Diastolic Dysfunction:
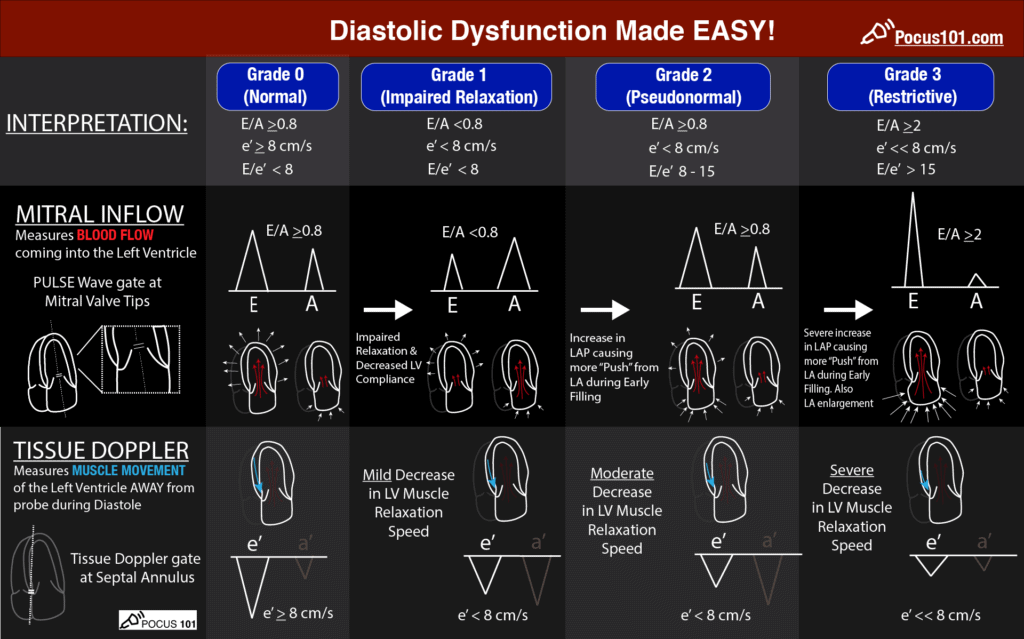
- Mitral Inflow: E/A >0.8
- Tissue Doppler: e’ > 8cm/s
- E/e’ < 8

Grade 1 Diastolic Dysfunction: Impaired Relaxation
The primary problem in Grade 1 Diastolic Dysfunction of the Left Ventricle is decreased compliance and impaired relaxation of the left ventricle.
Mitral Inflow Pattern for Grade 1 Diastolic Dysfunction
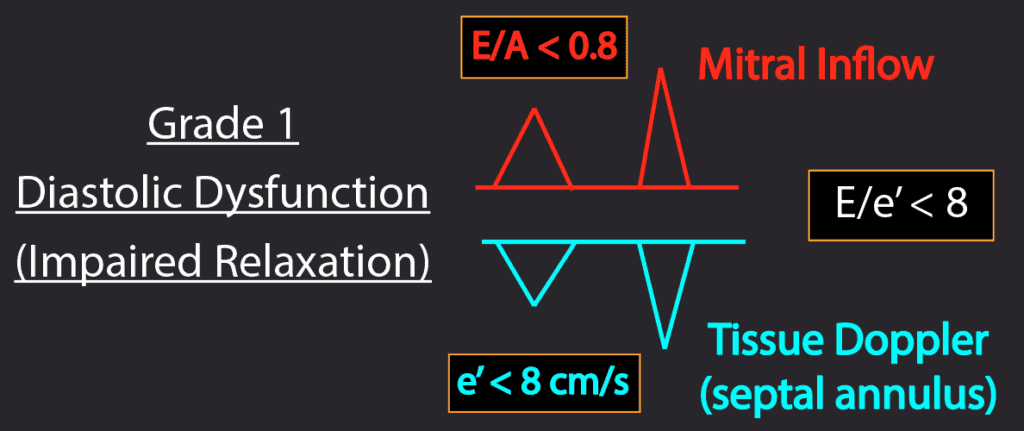
The first stage of diastolic dysfunction is impaired relaxation of the left ventricle. This results in a decrease of the normal “PULL” during early ventricular diastole and you will end up seeing a smaller amplitude E wave. The remaining blood is then pushed into the left ventricle during the atrial kick, resulting in a larger A wave.
So Grade 1 Diastolic Dysfunction will give you a very distinct mitral inflow pattern with an E/A ratio <0.8. It’s actually the ONLY mitral inflow pattern that has a ratio below 0.8. So if you see this, your patient has Grade 1 Diastolic Dysfunction. You can still measure the e’ measurements if desired, but it is not necessary.
(Editor’s note: Just be aware that Grade 1 Diastolic Dysfunction can be a normal finding as patients age.)
Grade 1 Diastolic Dysfunction: Mitral Inflow
- E wave: Decreased “PULL” from left ventricle due to impaired relaxation (small E wave).
- A wave: Atrial kick pushes in remaining excess blood (large A wave)
- E/A < 0.8

Tissue Doppler Pattern for Grade 1 Diastolic Dysfunction
Since the left ventricular muscle relaxation is impaired in Grade 1 Diastolic Dysfunction, you will see an e’ < 8cm/s. As diastolic dysfunction grade worsens you will see even smaller amplitude e’ velocities in Grade 2 and Grade 3 diastolic dysfunction.
Grade 1 Diastolic Dysfunction: Tissue Doppler
- Impaired left ventricular muscle relaxation
- e’ < 8cm/s

E/e’ Ratio for Grade 1 Diastolic Dysfunction
A patient with Grade 1 Diastolic Dysfunction will have an E/e’ ratio < 8. This is because both the E and e’ waves decrease and the relative ratio is preserved.
Since both Grade 0 and Grade 1 Diastolic Dysfunction will have E/e’ ratio < 8, you will have to rely on your E/A ratio. Grade 0 diastolic function will have E/A > 0.8 and Grade 1 diastolic dysfunction will have an E/A ratio of < 0.8.
Summary: Pattern for Grade 1 Diastolic Dysfunction (Impaired Relaxation)
Grade 1 diastolic dysfunction is actually one of the easiest to determine because it is the ONLY pattern that has E wave significantly lower than the A wave (<0.8). You can perform tissue Doppler as well to confirm or when there are borderline wave forms.
In summary what you should see for Grade 1 Diastolic Dysfunction:
- Mitral Inflow: E/A < 0.8 (MOST IMPORTANT FACTOR)
- Tissue Doppler: e’ < 8cm/s
- E/e’ < 8
Like this Post?
Sign Up For POCUS 101 Updates!
Grade 2 Diastolic Dysfunction: Pseudonormal
The primary problem in Grade 2 Diastolic Dysfunction is worsening left ventricular stiffness leading to increased Left Atrial Pressure +/- Left Atrial Enlargement.
Mitral Inflow Pattern for Grade 2 Diastolic Dysfunction: Pseudonormal
As diastolic dysfunction progresses and the left ventricle becomes stiffer, the left atrial pressures start to increase to accommodate the higher left ventricular diastolic pressures.
Therefore once the mitral valves opens in a patient with Grade 2 diastolic dysfunction, the elevated left atrial pressures will cause a significant amount of blood to flow into the left ventricle during early diastolic filling. This will result in an increased E wave on your mitral inflow pattern.
The KEY here is that the increased E wave is due to an increased PUSH from the left atrium, NOT from the PULL of the left ventricle (normal heart). This is what results in the term “Pseudonormalization” because the E and A waves pattern look like a normal waveform (E/A > 0.8).
So it will be necessary to also perform Tissue Doppler whenever you have a “normal” looking E/A ratio to be able to differentiate between Grade 0 versus Grade 2 Diastolic Dysfunction.
Grade 2 Diastolic Dysfunction: Mitral Inflow
- E wave: Increased “PUSH” from left atrium due to increased Left Atrial Pressure (large E wave)
- A wave: Most blood pushed in during early diastole (small A wave)
- E/A > 0.8 (looks like Grade 0)

Tissue Doppler Pattern for Grade 2 Diastolic Dysfunction
As the left ventricle becomes more stiff there will there will be slower relaxation resulting in a slower e’. A decrease in e’ (< 8cm/s) is the defining feature between Grade 0 (normal) and Grade 2 Diastolic Dysfunction.
Grade 2 Diastolic Dysfunction: Tissue Doppler
- Moderately Reduced LV muscle relaxation
- e’ < 8cm/s

E/e’ Ratio for Grade 2 Diastolic Dysfunction
A patient with Grade 2 Diastolic Dysfunction will have an E/e’ ratio between 8 -15.
Summary: Pattern for Grade 2 Diastolic Dysfunction (Pseudonormal)
Just remember that with normal mitral inflow patterns you need to do Tissue Doppler to differentiate between Grade 0 Diastolic Function (Normal) and Grade 2 Diastolic Dysfunction (Pseudoudnormal).
In summary what you should see for Grade 2 Diastolic Dysfunction:
- Mitral Inflow: E/A > 8
- Tissue Doppler: e’ < 8cm/s
- E/e’: 8-15

Grade 3 Diastolic Dysfunction: Restrictive
The primary problem in Grade 3 Diastolic Dysfunction is continued worsening left ventricular stiffness leading to SEVERE increased Left Atrial Pressure with Left Atrial Enlargement.
Mitral Inflow Pattern for Grade 3 Diastolic Dysfunction
As diastolic dysfunction becomes more chronic and the left ventricle becomes stiffer, the left atrial pressures must increase to accommodate the higher left ventricular diastolic pressures. This is especially seen in Grade 3 Diastolic Dysfunction or a restrictive filling pattern.
In Grade 3 diastolic dysfunction, there is severe increase in the left atrial pressure due to the significant decrease in left ventricular compliance.
In the early diastolic filling of a patient with Grade 3 diastolic dysfunction, almost all of the blood will fill the left ventricle from the PUSH of the extremely high pressures in the left atrium. You should see a very large and narrow E wave with an E/A ratio > 2.
Grade 3 Diastolic Dysfunction: Mitral Inflow
- E wave: Significant Increased “PUSH” from left atrial due to Severely increased Left Atrial Pressure (large and narrow E wave)
- A wave: small A wave
- E/A > 2

Tissue Doppler Pattern for Grade 3 Diastolic Dysfunction
In Grade 3 Diastolic Dysfunction, the muscle of the left ventricle will have severely reduced motion given the non-compliance of the LV. This will result in a very small e’ wave.
Grade 2 Diastolic Dysfunction: Tissue Doppler
- Severely reduced LV muscle relaxation
- e’ << 8cm/s

E/e’ Ratio for Grade 3 Diastolic Dysfunction
Since the E wave will be elevated and the e’ wave will be depressed, a patient with Grade 3 Diastolic Dysfunction will have an E/e’ ratio > 15.
Summary: Pattern for Grade 3 Diastolic Dysfunction (Restrictive)
Grade 3 diastolic dysfunction is usually easy to detect since there will be very high E wave, left atrial enlargement, and a small e’ wave.
Of note, the only difference between Grade 3 and Grade 4 diastolic dysfunction is that Grade 3 is considered “reversible” and Grade 4 is considered “irreversible.” You can evaluate this by doing a Valsalva maneuver and seeing if the mitral inflow waveform changes.
In summary what you should see for Grade 3 Diastolic Dysfunction:
- Mitral Inflow: E/A > 2 (very high E wave)
- Left Atrial Enlargement
- Tissue Doppler: e’ << 8cm/s
- E/e’ > 15

How to Practically Use Diastology To Manage Your Patients
So now that you know how to measure diastolic dysfunction, the next question is: how can you use this to change your management or treatment?
Going over the full details of all the possible scenarios is beyond the scope of this post. But here are some of the most common situations where you will want to think about looking at diastolic dysfunction to help manage your patients:
Assessing Preload Prior to and During IV Fluid Administration in Septic Shock Patients
Knowing the left-sided filling pressures in your patients prior to fluid administration can give you a sense of how much volume you think a patient can handle prior to a large amount of IV fluids. If your patient has normal diastolic function you may consider a more aggressive fluid approach.
However, if your patient has signs of diastolic dysfunction at the beginning of the resuscitation, you may want to have a more conservative approach to fluid management. This can involve a more frequent reassessment of the patient’s diastolic dysfunction (is it worsening), pulmonary status (pulmonary congestion), and end-organ venous congestion (liver, gut, kidneys). Check out this blog post on exactly how to evaluate for signs of venous congestion.
Congestive Heart Failure (CHF) and Diuresis Management Using Diastolic Dysfunction
You can use easily use diastolic dysfunction evaluation to assess and manage patients in CHF exacerbation in the emergency department, cardiac unit, or intensive care unit. I find it extremely helpful to pull up a recent echocardiogram the patient may have had and compare the grade of diastolic dysfunction they are currently in. This can give you a target goal for diuresis.
For example, if a patient normally lives in Grade 1 Diastolic Dysfunction at baseline and they currently have Grade 2 Diastolic Dysfunction in your emergency department, your goal should not be to diuresis them to Grade 0 because they don’t live there. Instead have a diuresis goal to get your patient back to Grade 1 Diastolic Dysfunction.
It is actually very easy to monitor the effects of your diuretic management and you can actually see the change of diastolic dysfunction in real-time!
Acute Respiratory Distress Syndrome (ARDS) Diagnoses Using Diastolic Dysfunction
One of the toughest diagnoses to pinpoint is ARDS since we stopped using invasive techniques such as the PA catheter. The diagnosis of ARDS requires that the pulmonary findings are NOT due to a cardiogenic cause (LVEDP or PCWP < 18mm Hg). *Left ventricular end-diastolic pressure (LVEDP) and Pulmonary Capillary Wedge Pressure (PCWP)
Assessing for diastolic dysfunction with echocardiography can help you determine if the left-sided pressures are normal (ARDS) or not (cardiogenic pulmonary edema).
In fact, there is even a formula by Nagueh et al you can use to estimate the PCWP based on your the E/e’ ratio. It is: LVEDP/PCWP = (1.24 * E/e’) + 1.9. Don’t worry about memorizing it, the diastolic dysfunction calculator I made will also output that value for you as well.
Diastolic Dysfunction Calculator:
Limitations of Echocardiography for Diastolic Dysfunction Evaluation
The main limitations of performing echocardiography for diastolic dysfunction are the technical difficulties of obtaining the images and getting them at the correct angle. If you are significantly off access (>20-30o) with your pulse wave or tissue Doppler sample gates, you may underestimate the values.
Other limitations of using echocardiography for diastolic dysfunction are:
- Arrhythmias. If there is significant tachycardia you may see fused E and A waves making it difficult to differentiate between the two. Also if the rate is irregular such as in atrial fibrillation you may have differing waveform readings between each beat.
- A prosthetic mitral valve may not give you accurate readings.
- Mitral annular calcification could make e’ measurements unreliable
References
- Nagueh, S., Smiseth, O., Appleton, C., Byrd, B., Dokainish, H., Edvardsen, T., Flachskampf, F., Gillebert, T., Klein, A., Lancellotti, P., Marino, P., Oh, J., Popescu, B., Waggoner, A. (2016). Recommendations for the Evaluation of Left Ventricular Diastolic Function by Echocardiography: An Update from the American Society of Echocardiography and the European Association of Cardiovascular Imaging. Journal of the American Society of Echocardiography : official publication of the American Society of Echocardiography 29(4), 277 – 314. https://dx.doi.org/10.1016/j.echo.2016.01.011
- Lanspa, M., Gutsche, A., Wilson, E., Olsen, T., Hirshberg, E., Knox, D., Brown, S., Grissom, C. (2016). Application of a simplified definition of diastolic function in severe sepsis and septic shock Critical Care 20(1), 8. https://dx.doi.org/10.1186/s13054-016-1421-3
- Nagueh, S., Middleton, K., Kopelen, H., Zoghbi, W., Quiñones, M. (1997). Doppler tissue imaging: a noninvasive technique for evaluation of left ventricular relaxation and estimation of filling pressures. Journal of the American College of Cardiology 30(6), 1527 – 1533. https://dx.doi.org/10.1016/s0735-1097(97)00344-6
- Mureddu, G., Faggiano, A. (2019). Utility and limitations of ejection fraction and of diastolic dysfunction in heart failure patients. Monaldi archives for chest disease = Archivio Monaldi per le malattie del torace 89(1)https://dx.doi.org/10.4081/monaldi.2019.1058
- Sanfilippo, F., Scolletta, S., Morelli, A., Vieillard-Baron, A. (2018). Practical approach to diastolic dysfunction in light of the new guidelines and clinical applications in the operating room and in the intensive care Annals of Intensive Care 8(1), 100. https://dx.doi.org/10.1186/s13613-018-0447-x
- Li, Y., Yin, W., Qin, Y., Zeng, X., Zou, T., Wang, X., Chao, Y., Zhang, L., Kang, Y., (CCUSG), C. (2018). Preliminary Exploration of Epidemiologic and Hemodynamic Characteristics of Restrictive Filling Diastolic Dysfunction Based on Echocardiography in Critically Ill Patients: A Retrospective Study BioMed Research International 2018(), 1-7. https://dx.doi.org/10.1155/2018/5429868


Great very useful, thanks!
Thanks Giacomo! Appreciate the comment.
Thanks for explaining this so elegantly! It all makes sense !
Thanks for the kind words Sahil!! Glad you found it useful. Hope you are doing well.
-Vi Dinh
Amazing, thank you
Appreciate the kind words! Glad you found it helpful.
[…] LV diastolic function, especially when trying to distinguish pseudo-normal pattern from normal on transmitral Doppler. It is typically performed in the apical 4-chamber view – right upper or lower vein, whichever is […]
Great and crystal clear explanation! I am going to practice measuring my diastolic function today!
Thank you very much Dr.Dinh
Yes absolutely Taweevat! I’m glad it is helping and let me know how it goes with the diastolic dysfunction measurements!
Your explanation is wonderful. You really break it down and make it easier to understand. Thank you.
I was wondering if the measurements could even be made more simple and it would be possible to use only the Tissue Doppler as a single measurement. It would seem this would be possible because the waves are always distinct between the different grades as opposed to the Mitral Inflow where the normal and pseudonormal can look the same.
Hi Jereme!
Thanks for the comment. Yes it is possible to only use Tissue Doppler. However if you want to get more precise estimates of the LVEDP you will need to use the E/e’ ratio which ends up requiring the mitral inflow values. Thanks again for reading! -Vi
I’m high as hell googling things about the heart cause I think I might have an issue surrounding this, no clue what yall are talking about but so cool ! Maybe I should rethink that cardiothoracic surgeon idea
THIS comment deserves more attention 😀
Haha, thanks 😆
[…] 1. https://www.pocus101.com/how-to-measure-and-grade-diastolic-dysfunction-using-echocardiography/ […]