

Learning Point of Care Ultrasound (POCUS) should be done on many levels. Hands-on scanning and lectures are important but to solidify your understanding of Point of Care Ultrasound (POCUS) concepts, using case-based questions and answers is definitely the way to go.
Dr. Alan Chiem, MD (Ultrasound Director at UCLA Olive View) and Myself (Vi Dinh, MD: Ultrasound Director at Loma Linda University Health) got together with Oxford University Press to create the first case-based question and answer POCUS board review book: The Emergency Medicine and Clinical Ultrasound Board Review Book. (20% off discount code: POCUS20)
This book was over two years in the making and we were able to enlist the top Point of Care Ultrasound Experts in the World to help us out! With over 70 contributing authors from over 20 renowned POCUS institutions, we believe this is the best Point of Care Ultrasound review book out there.
Who is this Book For?
- Physicians in Emergency Medicine, Critical Care, Internal Medicine, Family Medicine, Surgery, etc.
- Trainees (students and residents) who want advanced POCUS training
- Seasoned Physicians Wanting to Expand their POCUS knowledge
- Physicians Studying for the Critical Care Echo Boards through the NBE
- Fellowship-trained physicians studying for the Advanced Emergency Ultrasound Board Exam through ABEM
- Ultrasound Fellows
- POCUS scholars who want to find the “first-ever” or landmark articles for any POCUS topic
What’s in Book?
- 528 pages
- 18 chapters covering ultrasound topics such as physics, eFAST, echocardiography, thoracic, aorta, hepatobiliary, renal, pregnancy, soft tissue, ocular, procedural, airway, ENT, DVT, testicular, abdominal, and musculoskeletal applications
- Over 800 figures, tables, and online videos
- Over 1000 POCUS landmark journal references
- Over 500 multiple choice questions written in a case-based format that emulates the ABEM/NBE exams
How to Get the Book?
Normally this book is $129.95 but we were able to secure an exclusive 20% discount for POCUS 101 readers! Just go to Oxford University Press and make sure to input the code: POCUS20

If you prefer to buy the book on Amazon, you can click HERE as well.
Want a Sneak Peek?
In this post, we give you a sneak peek with 16 sample questions from the book below. Enjoy!
Table of Contents
Point of Care Ultrasound Cases
Ultrasound Case 1: Echocardiography
A 56-year-old female with history of end-stage renal disease on dialysis, hypertension, diabetes, and CREST syndrome presents with weakness. Vital signs are notable for T 38.3°C, BP 95/60, HR 115, RR 24, SpO2 94% on 2L nasal cannula. Physical exam is notable for an ill-appearing female with dry mucous membranes, bibasilar crackles, obese abdomen, and pretibial edema, with cap refill >2 seconds. You perform a bedside echocardiogram, which is notable for what clinical finding?

- A. McConnell’s Sign
- B. Carvallo’s Sign
- C. Ventricular Interdependence
- D. Focal Wall Motion Abnormality
Click HERE to go to the answer for Case 1.
Ultrasound Case 2: Echocardiography
A 52-year-old woman presents with pleuritic chest pain and dyspnea for 1 week. Her vital signs are T 37.5°C, BP 126/79, HR 83, RR 18, and SpO2 100% on room air. She has regular HR and rhythm on her cardiovascular examination, and there is mild expiratory wheezing bilaterally. Her focused echo is shown below:

Which echo window is shown above? How can the imaging be improved?
- A. Subxiphoid—slide probe to the right to avoid air artifact.
- B. Parasternal long axis—rotate the probe to identify the true long axis.
- C. Apical—slide one intercostal space inferiorly to avoid foreshortening.
- D. Parasternal short axis—tilt the probe scan plane apically to avoid a false-positive D-shaped LV.
Click HERE to go to the answer for Case 2.
Ultrasound Case 3: Physics/Knobology
What artifact is shown in the pulsed wave Doppler (PWD) image below?

- A. Twinkle artifact
- B. Aliasing artifact
- C. Reverberation artifact
- D. Ring-down artifact
Click HERE to go to the answer for Case 3.
Ultrasound Case 4: ICU Ultrasound
Your 89-year-old female patient is improving after her initial admission to the ICU for respiratory failure due to pneumonia. She is alert and normotensive and signals her desire to be removed from the ventilator. On her spontaneous breathing trial, you perform the thoracic ultrasound shown below:

What is your assessment?
- A. The patient has a consolidation
- B. The patient has pulmonary edema
- C. The patient is likely to be successfully extubated
- D. The patient is likely to fail her weaning trial
Click HERE to go to the answer for Case 4.
Like what you see? Check out the Complete Book HERE and enter the code: POCUS20 to get a 20% off discount!
If you prefer to buy the book on Amazon, you can click HERE as well.
Ultrasound Case 5: Aorta
A 57-year-old male with a history of tobacco use and known CAD presents to your ED with abdominal pain that has been intermittent for the past 3 days. He has a heart rate of 124 and his abdomen is soft. He is concerned because his father died from a ruptured AAA. A physical exam and ultrasound of the aorta are performed. Which of the findings can best help convince you and your patient that his pain and heart rate are not due to an aneurysm?
- A. Bruising is visible on the patient’s left flank and infrarenal aorta diameter is 4.5 cm
- B. Serial measurements of the aorta with a maximal measurement of 2.8 cm, normal appearance on longitudinal view
- C. No pulsating masses on abdominal exam, common iliac artery measurements bilaterally are 1.2 cm
- D. Measurements of the aorta at the level of the SMA and just distal are 2.6 cm, poor visualization of distal aorta due to bowel gas
Click HERE to go to the answer for Case 5.
Ultrasound Case 6: Hepatobiliary
One a scanning shift, you employ an X minus 7 technique, with the indicator pointed cephalad, to find the gallbladder in longitudinal axis of your first patient. On your second patient, employing the same technique, the gallbladder appears in an oblique transverse axis. What are the factors that account for variability in gallbladder position?
- A. The relative position of the gallbladder to the liver
- B. The relative position of the duodenum to the gallbladder
- C. The patient’s positioning
- D. All of the above
Click HERE to go to the answer for Case 6.
Ultrasound Case 7: Renal
A 38-year-old female with a history of multiple sclerosis presents with a worsening sensation of incomplete emptying after attempts to urinate. She reports a gradually reduced urgency to void over several years, accompanied by hesitancy in initiating flow of urine. When performing a bedside ultrasound, you calculate the volume of urine left in the bladder at the completion of micturition as noted in the Figure below. How would you interpret this result?

- A. Abnormal PVR
- B. Normal PVR
- C. Clinical correlation is required given that the patient is a female
- D. Bedside ultrasound is not relevant in determining a PVR value
Click HERE to go to the answer for Case 7.
Ultrasound Case 8: Thoracic
A bedside ultrasound is performed on a patient that confirms the presence of a pleural effusion. The admitting physician asks you to estimate the volume of the pleural effusion. How can the volume of a pleural effusion be quantified?
- A. It cannot be quantified.
- B. Length of the pleural effusion in the craniocaudal orientation and divided by the cross-sectional area at the apex of the effusion
- C. Length of the pleural effusion in the craniocaudal orientation multiplied by the cross-sectional area at the widest portion of the effusion
- D. Length multiplied by height and width of the pleural effusion
Click HERE to go to the answer for Case 8.
Like what you see? Check out the Complete Book HERE and enter the code: POCUS20 to get a 20% off discount!
If you prefer to buy the book on Amazon, you can click HERE as well.
Ultrasound Case 9: Obstetrics
A 26-year-old G3P2 female at 8 weeks EGA by last menstrual cycle presents with crampy lower abdominal pain. Her vital signs are stable. The pelvic exam is unremarkable and the cervical os is closed. You perform a transabdominal ultrasound and obtain the following images:

What is your diagnosis?
- A. Normal IUP and corpus luteum
- B. Heterotopic pregnancy
- C. Ectopic pregnancy
- D. Missed abortion
Click HERE to go to the answer for Case 9.
Ultrasound Case 10: Gynecology
A 27 year-old female presents with recurrent pelvic pain for the past several months. It occurs about a week after her period and is primarily left-sided. She also has noticed some pleuritic chest pain that is worse during these intervals as well. On exam, she looks well and has normal breath sounds but has lower left quadrant tenderness to palpation. Her pelvic exam is normal except for some left adnexal fullness and mild tenderness. Her urine pregnancy test is negative. You perform the following ultrasounds shown in Figure 10.19.

You suspect an endometrioma. What is true of endometriosis?
- A. Laparoscopy is the gold standard for diagnosis.
- B. It rarely affects the pulmonary and central nervous systems.
- C. It commonly spreads to adjacent peritoneal and retroperitoneal structures.
- D. All of the above
Click HERE to go to the answer for Case 10.
Ultrasound Case 11: Ocular
A 34-year-old diabetic male presents with atraumatic acute visual changes for 3 days in the left eye. He had noticed intermittent floaters, which progressed to what he describes now as “looking out of a rainy window.” Gross and slit lamp exam are normal. Visual acuities are left eye (OS) 20/200 and right eye (OD) 20/20. Visual field testing reveals a deficit in the superior field. You perform an ocular ultrasound which shows the following video.

What is the diagnosis?
- A. Retinal detachment
- B. Posterior vitreous detachment
- C. Vitreous hemorrhage
- D. Central retinal vein occlusion
Click HERE to go to the answer for Case 11.
Ultrasound Case 12: Procedures
A 17-year-old female presents with a posteriorly dislocated left elbow sustained during a hockey match. She is neurovascularly intact on exam. Which of the following is not a reliable option for analgesia to reduce her elbow?
- A. Brachial plexus nerve block at the interscalene level
- B. Brachial plexus nerve block at the supraclavicular level
- C. Intra-articular anesthetic injection
- D. Brachial plexus nerve block at the infraclavicular level
Click HERE to go to the answer for Case 12.
Like what you see? Check out the Complete Book HERE and enter the code: POCUS20 to get a 20% off discount!
If you prefer to buy the book on Amazon, you can click HERE as well.
Ultrasound Case 13: DVT/Thromboembolism
A 75-year-old man presents with chest pain and shortness of breath. He has a history of hypertension, prostate cancer, and prior DVT in the right lower extremity. His vital signs show blood pressure 154/92, heart rate 124, respiratory rate 20, pulse oximetry 88%, and temperature 99.4ºF. On exam, his left lower extremity is much larger than his right. A bedside ultrasound for DVT using a 2-point exam was found to be negative. Given that the practitioner used this protocol, what percentage of DVTs are likely to be missed?
- A. <10%
- B. 15%
- C. 20%
- D. 30%
Click HERE to go to the answer for Case 13.
Ultrasound Case 14: DVT/Thromboembolism
A 35-year-old female presents to the emergency department with pleuritic chest pain that began last night. She has no medical history. Her vital signs are a blood pressure of 100/72, heart rate of 115, respiratory rate of 16, pulse oximetry of 91%, and temperature of 100.0ºF. Her lab work and EKG are pending. You perform a bedside ultrasound of her heart, which is shown in the video below:

What is the most accurate way to interpret this finding?
- A. This is a sign of right heart dysfunction.
- B. This is pathognomonic for acute PE.
- C. This is a nonspecific sign but could represent pericarditis.
- D. This finding is specific for chronic pulmonary hypertension.
Click HERE to go to the answer for Case 14.
Ultrasound Case 15: Bowel
Which probe and orientation is optimal for visualization of the pylorus in long axis in an infant with concern for hypertrophic pyloric stenosis?
- A. Curvilinear low frequency, sagittal
- B. Curvilinear low frequency, transverse
- C. Linear high frequency, sagittal
- D. Linear high frequency, transverse
Click HERE to go to the answer for Case 15.
Ultrasound Case 16: Musculoskeletal
A 43-year-old man with a history of diabetes presents with left hip pain for the past week. The patient recently had pyelonephritis. He has tenderness elicited with both active and passive range of motion. Joint infection is suspected. What is the measurement of the anterior recess of the hip joint, along the femoral neck, that indicates a hip joint effusion?
What type of transducer is typically used to evaluate the hip joint?
- A. 20 mm, curvilinear transducer
- B. 50 mm, linear transducer
- C. 8 mm, curvilinear transducer
- D. 1 mm, linear transducer
Click HERE to go to the answer for Case 16.
Like what you see? Check out the Complete Book HERE and enter the code: POCUS20 to get a 20% off discount!
If you prefer to buy the book on Amazon, you can click HERE as well.
Answers/Explanation of Ultrasound Cases
Ultrasound Case 1: Echocardiography (Answer/Explanation)
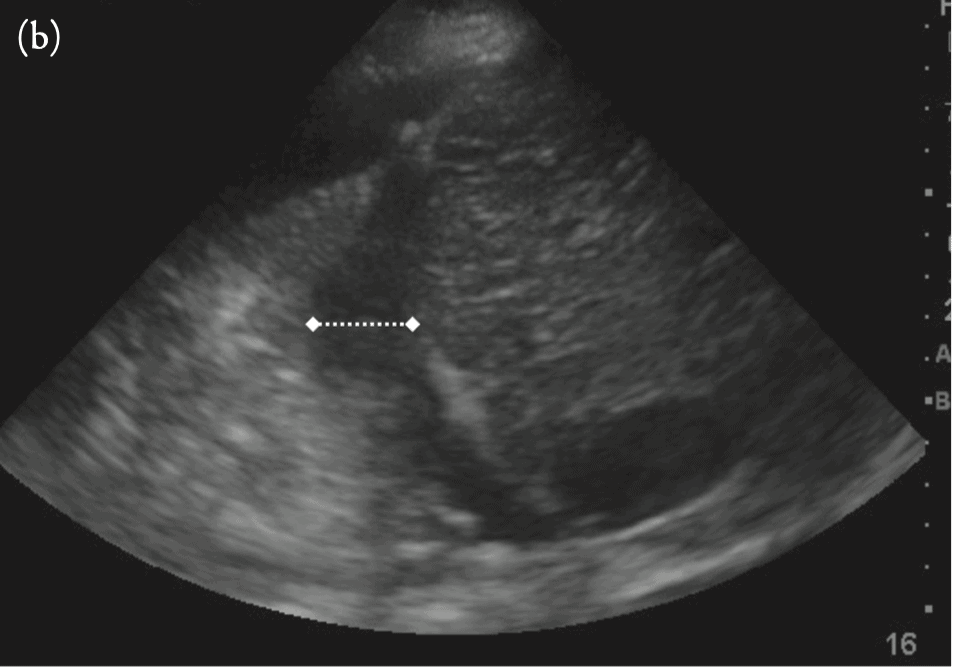
C. Ventricular interdependence. Based on your clinical history and findings, this patient most likely has cardiac tamponade, which is an equalization of intrapericardial pressure—due to the pericardial effusion—with first right and then left heart-filling pressures. Tamponade physiology occurs along a spectrum, as patients may be able to compensate with increased inotropy and chronotropy, as well as vasoconstriction to maintain their systemic pressures. One critical juncture in this spectrum is when one ventricle fills during diastole at the expense of the other. The negative intrathoracic pressures generated during inspiration leads to increased venous return, which leads to increased RV filling. However, since the RV cannot expand into the pericardial effusion, the IVS expands into the LV to accommodate. This leads to decreased LV filling and thus a temporary decrease in the cardiac output. The reverse happens during expiration, when there is decreased venous return, and the LV is allowed to fill at the expense of the RV.

On echocardiography, this can be seen as a bowing of the septum from right to left in diastole, as seen in the patient’s echo:
On PWD, using an A4C window, this will be seen as exaggerated velocities either on tricuspid or mitral inflow assessment. The criteria is typically an E wave ∆V max > 25% on tricuspid or mitral inflow.

Of note, ventricular interdependence is the basis for pulsus paradoxus, which is seen as a palpable diminution of the radial pulse (or drop in systolic BP ≥10 mmHg) with inspiration.
Carvallo’s sign is a physical examination finding associated with tricuspid regurgitation, where deep inspiration enhances the holosystolic murmur present due to the decreased intrathoracic pressure and, hence, increased flow through the regurgitant tricuspid valve. McConnell’s sign is an echocardiographic finding where there is hypokinesis of the RV free wall with apical sparing, classically associated with pulmonary embolism with RV dysfunction. Dyskinesia may appear similarly in ischemic causes of regional wall motion abnormality. However, the septal location and presence of other signs of cardiac tamponade render ischemic RWMA less likely.
Learning Point: Ventricular interdependence occurs when RV filling occurs at the expense of LV filling, leading to hypotension. It can occur with both cardiac tamponade and acute RV overload. It is associated with exaggerated tricuspid or mitral inflow variability using pulsed-wave Doppler (PWD).
Click HERE to go back to CASE 1
References:
- Armstrong WF, Ryan T. Hemodynamics. In: Feigenbaum’s Echocardiography. 7th ed. Philadelphia, PA: Lippincott Williams and Wilkins; 2010:216–218.
- Armstrong WF, Ryan T. Pericardial diseases. In: Feigenbaum’s Echocardiography. 7th ed. Philadelphia, PA: Lippincott Williams and Wilkins; 2010:241–262.
- Bove AA, Santamore WP. Ventricular interdependence. Prog Cardiovasc Dis. 1981;23(5):365–388.
- Grecu L. Cardiac tamponade. Int Anesthesiol Clin. 2012;50(2):59–77. Roy CL, Minor MA, Brookhart MA, Choudhry NK. Does this patient with a pericardial effusion have cardiac tamponade? JAMA 2007;297(16):1810–1818.
Like what you see? Check out the Complete Book HERE and enter the code: POCUS20 to get a 20% off discount!
If you prefer to buy the book on Amazon, you can click HERE as well.
Ultrasound Case 2: Echocardiography (Answer/Explanation)
D. Parasternal Short Axis—tilt the probe scan plane inferiorly to avoid a false-positive D-shaped LV. This is a parasternal short axis window that is showing what appears to be a dilated RV with flat IVS. However, the scan plane is not perpendicular to the imaged structures, but rather an oblique plane that is between the short axis and an apical window.

For this reason, the RV appears to be enlarged and the septum, flat, since in an A4C window, the RV is larger and the septum appears linear as compared to a parasternal short axis window. Note the appearance of the RV moderator band, seen as a horizontal linear structure just deep to the RV free wall. This should not be seen on a true parasternal short axis window, as the moderator band is located near the apex.
To confirm RV dilatation and septal flattening, tilt the probe so that the scan plane is pointed more apically or inferiorly to image a more perpendicular plane. See the figure below on how to avoid a false “D-shaped” left ventricle by tilting the scan plane inferiorly:

If the RV appears smaller and the septum rounds out, then there is no RV strain. If the RV continues to be dilated and the septum is flat, then RV strain is the likely diagnosis. In general, tilting in parasternal short axis to visualize all levels is not recommended due to the many oblique planes generated. Instead, sliding from base to apex in a plane perpendicular to the imaged structures is recommended.
Apical foreshortening is also a common problem, as it leads to a falsely thickened LV and, thus, estimates of systolic function. It occurs when the scan plane is oriented obliquely, from the anterior apex to the posterior wall of the atria. In a foreshortened window, the atria look small, while the apical myocardium appears as thick or even thicker than the septal and lateral myocardium. Normally, the apical myocardium is thin compared to these walls.

Sliding inferiorly to the next intercostal space below often corrects the apical foreshortening:

Learning Point: Foreshortening occurs when the apical plane cuts through the ventricle just anterior or posterior to the apex. It results in both inaccurate measurement of the LV chamber and may result in a false-positive D-shaped left ventricle.
Click HERE to go back to CASE 2
Reference:
Lang RM, Badano LP, Mor-Avi V, et al. Recommendations for cardiac chamber quantification by echocardiography in adults: an update from the American Society of Echocardiography and the European Association of Cardiovascular Imaging. J Am Soc Echocardiogr. 2015;28(1):1–39.e14. doi:10.1016/j. echo.2014.10.003.
Like what you see? Check out the Complete Book HERE and enter the code: POCUS20 to get a 20% off discount!
If you prefer to buy the book on Amazon, you can click HERE as well.
Ultrasound Case 3: Physics Knobology (Answer/Explanation)
B. Aliasing artifact. In both spectral and color flow imaging, the velocity scale setting is crucial to the display of signals. Aliasing is related to the fact that both of these imaging modalities use pulsed sound beams. Each pulse is timed to allow for the prior pulses’ echoes to return and is governed by the pulse repetition frequency (PRF). If the frequency of the Doppler shift exceeds half the PRF (also known as the Nyquist limit), ambiguous or aliased signals are produced. The machine is unable to tell either the velocity and/or direction of flow due to aliasing.

Assume that all wheels are rotating in a clockwise fashion but at variable speed. If the sampling rate is fixed at 4 times per minute, the top wheel will be seen rotating in a clockwise direction and its velocity will be accurate at 1 turn per minute. The middle wheel has a velocity of 2 turns per minute. However, at the fixed sampling rate, the velocity estimated will be correct, but no directionality can be assessed since the wheel can be moving clockwise or counterclockwise. The bottom wheel spins at three rounds per minute. Using the fixed sampling rate, the wheel will appear to rotate counterclockwise at a speed of 1 turn per minute. Increasing the sampling rate to 5 times per minute will accurately determine the speed and directionality of the middle wheel. Increasing the sampling rate to 7 times per minute will accurately sample all wheel directions and velocities. The sampling rate conceptually is the pulse repetition frequency.
Spectral tracing typically shows a wraparound effect while color aliasing projects the color of turbulent flow (typically blue-green) within central areas of higher laminar velocity. Aliasing can be avoided by increasing the velocity scale (which also increases the PRF) or by changing the baseline setting. Using a lower ultrasound frequency will also reduce the frequency shift, which will reduce the probability of aliasing. Switching to continuous-wave Doppler (CWD) will also avoid aliasing as the velocity ranges exceed that of PWD. However, the velocities of the entire sampling path are displayed, and not just a sample volume. Increasing the insonation angle will reduce the Doppler shift, and therefore reduce aliasing, but will lead to a more imprecise velocity estimation.
Learning Poing: Aliasing occurs in Doppler imaging when the frequency shift exceeds the Nyquist limit. It leads to incorrect directionality and/or velocity estimation.
Click HERE to go back to CASE 3
References:
- Pozniak MA, Zagzebski JA, Scanlan KA. Spectral and color Doppler artifacts. RadioGraphics. 1992;12:35– 44.
- Pellett AA, Tolar WG, Merwin DG, Kerut EK. Doppler aliasing. Echocardiography. 2005;22(6):540–543.
- Solomon SD. Echocardiographic instrumentation and principles of Doppler echocardiography. In: Solomon SD, ed. Essential Echocardiography. 1st ed. Totowa, NJ: Humana Press; 2007:3–18.
Like what you see? Check out the Complete Book HERE and enter the code: POCUS20 to get a 20% off discount!
If you prefer to buy the book on Amazon, you can click HERE as well.
Ultrasound Case 4: ICU Ultrasound (Answer/Explanation)
D. The patient is likely to fail her weaning trial. The patient has evidence of diaphragmatic dysfunction (DD) on thoracic ultrasound. In a recent meta-analysis, this was associated with a sensitivity of 85% and 8.8 odds ratio of spontaneous breathing trial failure as opposed to those without DD.
DD is assessed by measuring the diaphragmatic excursion (DE) and the diaphragmatic thickening fracture (DTF). For DE, place a low-frequency transducer in the mid to post-axillary line with the indicator pointed cephalad, similar to a FAST window. Place the M-mode line at the juncture of the diaphragm and vertebral column or the costal-diaphragmatic junction. The tracing will reveal peaks with the amplitude of the peaks directly related to the inferior displacement of the diaphragm. A DE value of ≤1015 mm for normal spontaneous breathing and <25 mm for maximal inspiratory effort is considered abnormal. The figure below shows normal diaphragmatic excursion using M-mode:

For DTF measurement, a high-frequency transducer is used in the same position as DE measurement, and M-mode is also employed. The diaphragm thickness is less during expiration (DTe) and greater than inspiration (DTi). The DTF is calculated as (DTi – DTe)/DTe. A DTF <30% (with a range of 24%–35% in most studies) is considered abnormal. The figure below shows normal diaphragmatic thickening fraction using M-mode:

Our patient had a DTF of 4.4% and DE of 2.7 mm, so there is clear diaphragmatic dysfunction.
Learning Point: Identify diaphragmatic dysfunction as part of the assessment for extubation.
Click HERE to go back to CASE 4
References:
- Kim WY, Suh HJ, Hong SB, Koh Y, Lim CM. Diaphragm dysfunction assessed by US: influence on weaning from mechanical ventilation. Crit Care Med. 2011;39(12):2627–2630.
- Qian Z, Yang M, Li L, Chen Y. Ultrasound assessment of diaphragmatic dysfunction as a predictor of weaning outcome from mechanical ventilation: a systematic review and meta-analysis. BMJ Open. 2018;8(9):e021189.
- Zambon M, Greco M, Bocchino S, Cabrini L, Beccaria PF, Zangrillo A. Assessment of diaphragmatic dysfunction in the critically ill patient with ultrasound: a systematic review. Intensive Care Med. 2017;43(1):29–38.
Like what you see? Check out the Complete Book HERE and enter the code: POCUS20 to get a 20% off discount!
If you prefer to buy the book on Amazon, you can click HERE as well.
Ultrasound Case 5: Aorta (Answer/Explanation)
B. Serial measurements of the aorta with a maximal measurement of 2.8 cm, normal appearance on longitudinal view. An aneurysm of an arterial vessel is defined as a diameter of 1.5 cm or more from normal (Johnston 1991). The normal aorta tapers distally to approximately 1.5 cm, ending at the level of L4, at the umbilicus, where it divides into the iliac arteries. Understanding that the aorta tapers is important, as the supraceliac aorta can measure 2.7 cm; a supraceliac aorta diameter of 3 cm is not abnormal given the definition of an aneurysm (Table 6.1).

The infrarenal aorta should not have an anterior-posterior diameter greater than 3 cm, and an aneurysm of the common iliac artery is present in diameters greater than 1.5 cm for women and 1.8 cm for men (Bacharach 2008). Luminal diameter does vary with age and sex, and young male and female patients without known atherosclerotic disease have infrarenal aortic diameters of about 2.3 cm and 1.9 cm, respectively.
Physical exam is limited by body habitus and abdominal circumference. Detection of AAA is increased on physical exam by deep palpation of the abdomen to detect an abnormal widening of the aortic pulsation. Sensitivity increases with increased AAA diameter. The absence of a pulsating mass on abdominal exam does not rule out an AAA (Lederle 1999). Ecchymosis of the flanks, though rare, is indicative of retroperitoneal hematoma and, when present in a patient with family history of AAA as well as tachycardia and abdominal pain, should increase clinical suspicion for ruptured AAA (Epperla 2015).
Learning Points: Infraceliac aortic aneurism is defined as an anterior to posterior diameter >3 cm. Iliac arteries are aneurismal at 1.5 cm for women and 1.8 cm for men.
Click HERE to go back to CASE 5
References:
- Bacharach JM, Slovut DP. State of the art: management of iliac artery aneurysmal disease. Catheter Cardiovasc Interv. 2008;71(5):708–714.
- Epperla N, Mazza JJ, Yale SH. A review of clinical signs related to ecchymosis. WMJ. 2015;114(2):61– 65.
- Johnston KW, Rutherford RB, Tilson MD, Shah DM, Hollier L, Stanley JC. Suggested standards for reporting on arterial aneurysms. Subcommittee on Reporting Standards for Arterial Aneurysms. J Vasc Surg. 1991;13(3):452– 458.
- Lederle FA, Simel DL. The rational clinical examination. Does this patient have abdominal aortic aneurysm? JAMA. 1999;281(1):77–82.
- Wanhainen A, Themudo R, Ahlström H, Lind L, Johansson L. Thoracic and abdominal aortic dimension in 70-year-old men and women—a population-based whole-body magnetic resonance imaging (MRI) study. J Vasc Surg. 2008;47(3):504–512.
Like what you see? Check out the Complete Book HERE and enter the code: POCUS20 to get a 20% off discount!
If you prefer to buy the book on Amazon, you can click HERE as well.
Ultrasound Case 6: Hepatobiliary (Answer/Explanation)
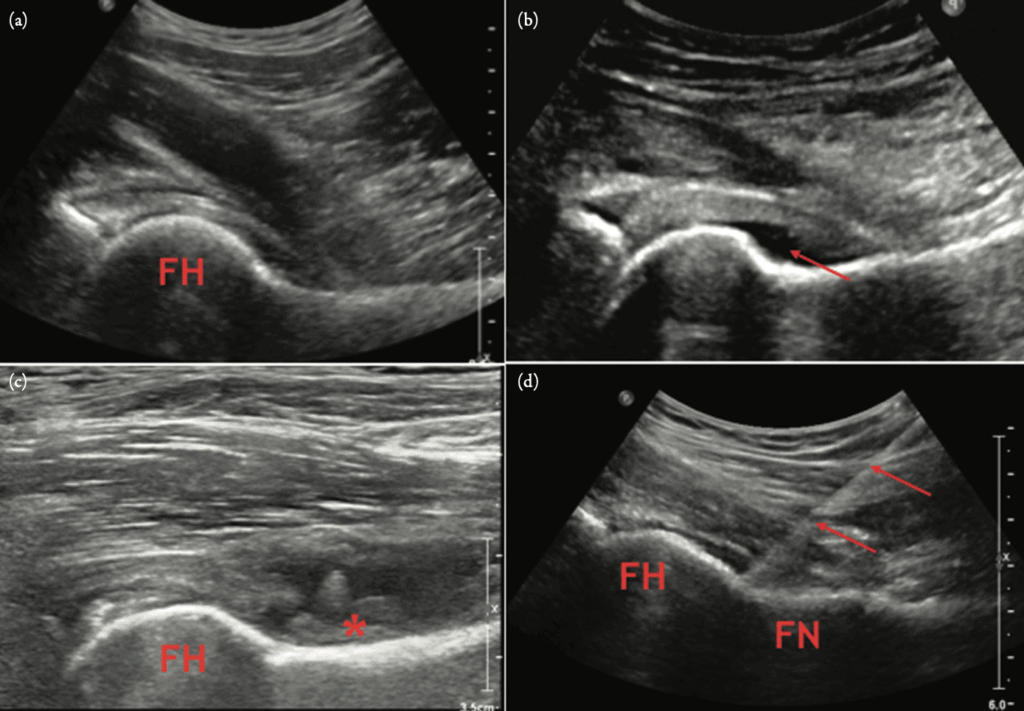
D. All of the above. The gallbladder is attached to the inferior surface of the liver via the loose connective tissue of the visceral peritoneum. From fundus to neck, the gallbladder sits typically in an inferior-superior to superior-posterior position. The fundus often lies more anterior and inferior than the inferior liver margin. The neck is less mobile due to its relationship to the portal triad, which is found within the hepatoduodenal ligament that binds the duodenum to the liver.
The gallbladder body and fundus are relatively more mobile and can change position due to mass effect from adjacent organs like the ascending colon and duodenum, or body positioning. As a result of its variable position, many techniques must be employed to image the gallbladder, from subcostal to anterior or axillary intercostal spaces (see figure below). The use of a phased array transducer, which has a much smaller footprint than a curvilinear transducer, may be helpful to minimize rib-shadowing artifact.

(Panel a) Anatomy of gallbladder and mobility. This view of the liver is from a posterior-to-anterior vantage point. The gallbladder neck and infundibulum (indicated by red bars) lie in the gallbladder fossa, which is where the porta hepatitis and portal triad are also found. These structures are held together by the hepatoduodenal ligament, rendering the proximal gallbladder relatively less mobile. In contrast, the body and fundus (indicated by green bars) are surrounded by loose connective tissue of the visceral peritoneum, and are relatively more mobile. Adapted from Figure 1086 of Gray H. Anatomy of the Human Body. New York, NY: Lea & Febiger; 1918.
(Panel b) Variable position of gallbladder. The gallbladder is a highly mobile organ, with its positioning due to the anatomy of the gallbladder fossa in the liver, mass effect from adjacent duodenum (D) and ascending colon (AC), and patient positioning. There are, however, some common orientations to note. In blue, the gallbladder, from fundus to neck, is in an inferior-to-superior orientation. In green, it is in a lateral-to-medial orientation, and in red, it is largely anterior to posterior. Recognizing these common orientations will help the sonographer to develop a three dimensional sense of the gallbladder that is necessary for ultrasound imaging.
Learning Point: The relationship of the gallbladder to the surface anatomy is highly variable. Sonographers must learn to identify and distinguish the gallbladder’s longitudinal and transverse axes from the surface anatomy.
Click HERE to go back to CASE 6
References:
- Gadzijev EM. Surgical anatomy of hepatoduodenal ligament and hepatic hilus. J Hepatobiliary Pancreat Surg. 2002;9(5):531–533. Gray H. Anatomy of the Human Body. New York, NY: Lea & Febiger; 1918.
- Noble VE, Nelson B. Gallbladder ultrasound. In: Noble VE, Nelson B, eds. Emergency and Critical Care Ultrasound. 2nd ed. New York, NY: Cambridge University Press; 2011:151–171.
- Westacott S, Mahraj R. Normal gallbladder anatomy and imaging. In: Meilstrup JW, ed. Imaging Atlas of the Normal Gallbladder and Its Variants. Boca Raton, FL: Taylor & Francis; 2018:3–12.
Like what you see? Check out the Complete Book HERE and enter the code: POCUS20 to get a 20% off discount!
If you prefer to buy the book on Amazon, you can click HERE as well.
Ultrasound Case 7: Renal (Answer/Explanation)
A. Abnormal PVR. The patient is experiencing detrusor-sphincter dyssynergia (i.e., neurogenic bladder) very likely due to her history of multiple sclerosis. The ultrasound shows a significantly distended bladder with a PVR of 673 mL. This is typically a gradual process that often results in chronic urinary retention, and the diagnosis may be confirmed by obtaining a PVR volume via bladder catheterization, or via bladder ultrasound (Ghani 2008). A study by Hvarness in 2002 found ultrasound to be accurate in predicting PVR volume but, depending on the calculation method used, can under- or overestimate with errors in the range of 56% to +58.8%.
It is important to note that there is no standardized acceptable normal range for PVR. However, most published sources on the topic suggest that a PVR <50 mL is typical in most healthy, asymptomatic patients.
Additionally, a PVR of 50 to 100 mL is also acceptable in many symptomatic patients and is common in patients over age 65. A PVR of 100 to 200 mL requires clinical correlation, and a value >200 mL is generally considered abnormal (Kelly 2004).
Learning Points: Bladder emptying: <50 mL PVR normal. <100 mL PVR is acceptable in patients >65.
Click HERE to go back to CASE 7
- Ghani KR, Pilcher J, Rowland D, Patel U, Nassiri D, Anson K. Portable ultrasonography and bladder volume accuracy—a comparative study using three-dimensional ultrasonography. Urology. 2008;72(1):24–28.
- Hvarness H, Skjoldbye B, Jakobsen H. Urinary bladder volume measurements: comparison of three ultrasound calculation methods. Scand J Urol Nephrol. 2002;36(3):177–181.
- Kelly CE. Evaluation of voiding dysfunction and measurement of bladder volume. Rev Urol. 2004;6(Suppl 1):S32–S37.
Like what you see? Check out the Complete Book HERE and enter the code: POCUS20 to get a 20% off discount!
If you prefer to buy the book on Amazon, you can click HERE as well.
Ultrasound Case 8: Thoracic (Answer/Explanation)
C. Length of the pleural effusion in the craniocaudal orientation and multiplied by the cross-sectional area at the widest portion of the effusion. While many methods have been described to quantify the size of a pleural effusion, probably the most accurate method is the Remerand method, which is described here (Figure below). This method was found to correlate well with the fluid drained on thoracentesis and the fluid measured by CT.
How to use the Remérand method for quantifying pleural effusion volume: The upper (1) and lower (2) paravertebral intercostal spaces where a pleural effusion (PE) is detected are drawn on the patient’s skin. (3) The PE paravertebral length (LUS) is measured between these two points (in cm). (4) The middle of the PE height was located. At this point, the probe is applied to the skin in transverse plane, at end-expiration, as posterior as possible. (5) The cross-sectional area at mid-length (AUS) is measured in cm2. (6) Ultrasound PE volume (in ml) is calculated by multiplying LUS by AUS.

A less accurate but possibly simpler method is called the Balik method, and it involves measuring the maximal effusion thickness between the diaphragm and base of lung in a supine patient (see Figure Below) and multiplying that number by 20.
A supine chest X-ray requires as much as 500 mL of fluid to accumulate before it is reliably detectable, and an upright may need as much as 175 mL of fluid to accumulate before it is reliably detectable (Eibenberger, 1994).
Learning Point: The volume of a pleural effusion is best measured by the Remerand method.
Click HERE to go back to CASE 8
References:
- Balik M, Plasil P, Waldauf P, et al. Ultrasound estimation of volume of pleural fluid in mechanically ventilated patients. Intensive Care Med. 2006;32(2):318.
- Dietrich CF, Mathis G, Cui XW, Ignee A, Hocke M, Hirche TO. Ultrasound of the pleurae and lungs. Ultrasound Med Biol. 2015;41(2):351–365.
- Eibenberger KL, Dock WI, Ammann ME, Dorffner R, Hörmann MF, Grabenwöger F. Quantification of pleural effusions: sonography versus radiography. Radiology. 1994;191(3):681– 684.
- Ibitoye BO, Idowu BM, Ogunrombi AB, Afolabi BI. Ultrasonographic quantification of pleural effusion: comparison of four formulae. Ultrasonography (Seoul, Korea). 2018;37(3):254–260.
- Remérand F, Dellamonica J, Mao Z, et al. Multiplane ultrasound approach to quantify pleural effusion at the bedside. Intensive Care Med. 2010;36(4):656– 664. doi:10.1007/s00134-010-1769-9
Like what you see? Check out the Complete Book HERE and enter the code: POCUS20 to get a 20% off discount!
If you prefer to buy the book on Amazon, you can click HERE as well.
Ultrasound Case 9: Obstetrics (Answer/Explanation)
A. Normal IUP and corpus luteum. This ultrasound image shows a normal first-trimester pregnancy, with a gestation sac containing a yolk sac and surrounded by decidual reaction. The cystic structure in the adnexa is a corpus luteum. The corpus luteum forms in the ovary after ovulation. When fertilization occurs, the corpus luteum begins secreting progesterone and continues for approximately 10 weeks, when the placenta takes over. Corpus luteum is differentiated from an ectopic pregnancy because it is in the ovary, is surrounded by normal ovarian tissue, moves with the ovary with manipulation, and typically does not have a thick echogenic ring. In this case, the presence of an IUP also makes ectopic pregnancy unlikely.
Heterotopic pregnancy occurs when there is both an IUP and an ectopic pregnancy. This is extremely rare in the general population but should be considered in women undergoing fertility treatment.
A missed abortion would be seen as an empty gestational sac, also known as a “blighted ovum.” This is due to stunted or no development of the embryo after conception. To make this diagnosis, the mean sac diameter (MSD) should be calculated by measuring inner wall to inner wall measurements of the sac in 3 orthogonal planes and dividing the total by 3. A MSD >25 mm is definitive for missed abortion (Figure below). Of note, early molar pregnancies may appear similarly, so referral to OB is warranted for follow-up βhCG levels and ultrasound.

calculated from three planes of the sac, and divided by 3. A mean sac diameter >25 mm without evidence of fetal pole or yolk sac is definitive for failed pregnancy.
Learning Point: Corpus luteum is differentiated from an ectopic pregnancy because it is in the ovary, is surrounded by normal ovarian tissue, moves with the ovary with manipulation, and typically does not have a thick echogenic ring.
Click HERE to go back to CASE 9
References:
- DeVoe RW, Pratt JH. Simultaneous intrauterine and extrauterine pregnancy. Am J Obstet Gynecol. 1948;56(6):1119–1126.
- Doubilet PM, Benson CB, Bourne T, et al. Diagnostic criteria for nonviable pregnancy early in the first trimester. Ultrasound Q. 2014 Mar;30(1):3–9.
- Fernandez H, Gervaise A. Ectopic pregnancies after infertility treatment: modern diagnosis and therapeutic strategy. Hum Reprod Update. 2004;10(6):503–513.
- Levine D, Brown DL, Andreotti RF, et al. Management of asymptomatic ovarian and other adnexal cysts. Radiology. 2010;256(3):943–954.
Like what you see? Check out the Complete Book HERE and enter the code: POCUS20 to get a 20% off discount!
If you prefer to buy the book on Amazon, you can click HERE as well.
Ultrasound Case 10: Gynecology (Answer/Explanation)
D. All of the above. This patient has an endometrioma on transvaginal ultrasound. This estrogen-dependent cyst resembles a hemorrhagic ovarian cyst, but it has a more homogenous appearance to its internal echoes. In Panel A, note the homogenous “ground glass” echogenic texture in the cyst. Endometriomas are seen in up to 20% of women, with about 25% occurring bilaterally. Her recurrent pelvic pain and pleuritic chest pain associated with her menstrual cycle highly suggests endometriosis with distal involvement as the cause of her symptoms.
Endometriosis is characterized by the spread of endometrial tissue outside of the uterus. The mechanism(s) of spread are unknown but can be from metaplasia, lymphatic spread, or direct implantation from ectopic endometrium that travel in “retrograde menstruation” from the fallopian tubes to the peritoneum. Sites for spread of endometriosis are commonly retroperitoneal or peritoneal but less commonly involve the pulmonary system or the central nervous system. In Panel B, note the presence of the vertebral column above the diaphragm (spine sign), indicating an effusion from endometrial tissue invading the pleura. The fibrin strands from the hemothorax are also visualized. Pulmonary involvement in endometriosis is rare but may be associated with pulmonary cysts, hemothorax, and pneumothorax. A laparoscopic evaluation is the gold standard, as it will confirm the diagnosis as well as allow for surgical management. NSAIDs and oral contraceptives may be considered for less severe presentations.
Learning Point: Endometriosis is characterized by endometrial tissue that has migrated outside of the uterus. It is a common cause of dysmenorrhea, dyspareunia, and chronic pain and is associated with infertility. Endometriomas are cysts with homogenous “ground glass” internal echoes.
Click HERE to go back to CASE 10
References:
- Brosens I, Puttemans P, Campo R, Gordts S, Brosens J. Non-invasive methods of diagnosis of endometriosis. Curr Opin Obstet Gynecol. 2003;15(6):519–522.
- Hsu AL, Khachikyan I, Stratton P. 2010 Invasive and non-invasive methods for the diagnosis of endometriosis. Clin Obstet Gynecol. 2010;53(2):413– 419.
- Jerman LF, Hey-Cunningham AJ. The role of lymphatic system in endometriosis: : a comprehensive review of the literature. Biol Reprod. 2015;92(3):64.
- Nair SS, Nayar J. Thoracic endometriosis syndrome: a veritable Pandora’s box. J Clin Diagn Res. 2016;10(4):QR04–QR08.
Like what you see? Check out the Complete Book HERE and enter the code: POCUS20 to get a 20% off discount!
If you prefer to buy the book on Amazon, you can click HERE as well.
Ultrasound Case 11: Ocular (Answer/Explanation)
Retinal detachment. RDs are important to recognize as early intervention can prevent significant vision loss.
Normally, the retina is attached anteriorly to the ora serrata and posteriorly to the optic nerve. It is adhered anteriorly to the choroid of the eye. There are three different types of RDs: tractional, retinal tears (aka rhegmatogenous), and exudative. Rhegmatogenous RDs are due to round holes, tears, or breaks in the retina and subsequent filling of the subretinal space with vitreous fluid. It is the most common cause of RD (D’Amico 2008).

Tractional RDs occur via centripetal mechanical forces on the retina, usually mediated by fibrotic tissue resulting from previous hemorrhage, injury, surgery, infection, or inflammation. Correction of tractional RD requires disengaging scar tissue from the retinal surface, and vision outcomes are often very poor.
Exudative RD (Figure 12.26a, Video 12.9) results from the accumulation of serous and/ or hemorrhagic fluid in the subretinal space because of hydrostatic factors (e.g., severe acute hypertension), inflammation (e.g., sarcoid uveitis), or neoplastic effusions (Amer et al. 2017). Exudative RDs generally resolve with successful treatment of the underlying disease, and visual recovery is often excellent. The main difference between rhegmatogenous RD and the other 2 types is that rhegmatogenous RDs have a tear in the retina whereas tractional and exudative do not (Gariano 2004).

Tractional and exudative RDs may not be detected on ultrasound early on. If a clinical story is suspicious, RD should still be considered and an ophthalmology consult should be obtained for indirect fundoscopy. Sonographic findings of RD display a thin, hyperechoic linear membrane floating in the posterior chamber of the eye but tethered to the optic disc. Vitreous detachments, on the other hand, will have nontethered haphazard movement. RDs also typically can be seen with normal gain while vitreous detachments (VDs) often require over gain for accurate assessment. The urgency of ophthalmology evaluation and surgical repair depends largely on the relation of the retina to the macula. The macula is directly lateral to the optic nerve sheath. If the retina is still attached to the macula with only minimally impaired vision (aka “mac on”), the patient should receive emergent ophthalmology consultation and surgery to prevent further detachment from the macula.
This can significantly preserve a patient’s vision. Conversely, retina detachments that involve the macula typically present with more drastic impaired vision, and surgical intervention is less likely to be beneficial, especially if the duration is greater than 7 days, with the best outcomes associated with duration less than 3 days (Van Bussel et al. 2014). Choices B and C are incorrect as vitreous detachment and hemorrhage are not tethered to the optic nerve as demonstrated in the video. Choice D is incorrect: central retinal vein occlusion (CVRO) and central retinal artery occlusion (CRAO) typically require Doppler to assess for vascular flow deficits or ultrasound is used to visualize emboli in the retrobulbar space.
Click HERE to go back to CASE 11
References:
- Amer R, Nalcı H, Yalçındağ N. Exudative retinal detachment. Surv Ophthalmol. 2017;62(6):723–769.
- Blumenkranz MS, Byrne SF. Standardized echography (ultrasonography) for the detection and characterization of retinal detachment. Ophthalmology. 1982;89(7):821–831.
- D’Amico DJ. Clinical practice: primary retinal detachment. N Engl J Med. 2008;359(22):2346–2354.
- Gariano R, Kim C. Evaluation and management of suspected retinal detachment. American Family Physician 2004;69(7):1691–1698.
- Van Bussel EM, van der Valk R, Bijlsma WR, La Heij EC. Impact of duration of macula-off retinal detachment on visual outcome. Retina. 2014 Oct;34(10):1917–1925.
- Vrablik ME, Snead GR, Minnigan HJ, Kirschner JM, Emmett TW, Seupaul RA. The diagnostic accuracy of bedside ocular ultrasonography for the diagnosis of retinal detachment: a systematic review and meta-analysis. Ann Emerg Med. 2015;65(2):199–203.
Like what you see? Check out the Complete Book HERE and enter the code: POCUS20 to get a 20% off discount!
If you prefer to buy the book on Amazon, you can click HERE as well.
Ultrasound Case 12: Procedures (Answer/Explanation)
A. Brachial plexus nerve block at the interscalene level. Brachial plexus block at the interscalene level will provide anesthesia to the arm above the elbow but has inconsistent blockade of the inferior trunk (C8–T1), so it would not be an ideal choice for an elbow injury. However, a low interscalene block—about 2 to 3 cm below the level of the cricoid cartilage, has been shown to be effective for patients undergoing elbow surgery (Gadsen et al. 2009).This is midway between an interscalene block and a supraclavicular block of the brachial plexus (see figure, panel a)

A brachial plexus block at the infraclavicular level will provide dense sensory and motor blockade to the distal upper arm including the elbow, down through the hand. There is a lower risk of phrenic nerve paralysis compared to a supraclavicular block, which will anesthetize the same regions, but it is considered more technically difficult. Compared to the interscalene block, both supraclavicular and infraclavicular brachial plexus blocks are associated with a higher risk of pneumothorax, as the pleural lining is just deep to the brachial plexus at these sites (see figure, panel b). Although not yet described in the literature, it may be feasible to perform an intraarticular injection of local anesthetic to attempt reduction.
Learning Point: Brachial plexus block at the infraclavicular level will provide dense sensory and motor blockade to the distal upper arm including the elbow, down through the hand. There is a much lower risk of phrenic nerve paralysis compared to a supraclavicular block, which will anesthetize the same regions. Brachial plexus block at the interscalene level will provide anesthesia to the arm above the elbow but would not be adequate for an elbow injury.
Click HERE to go back to CASE 12
References:
- Gadsen JC, Tsai T, Iwata T, Somasundarum L, Robards C, Hadzic A. Low interscalene block provides reliable anesthesia for surgery at or about the elbow. J Clin Anesth. 2009;21:98–102.
- Heflin T, Ahern T, Herring A. Ultrasound-guided infraclavicular brachial plexus block for emergency management of a posterior elbow dislocation. Am J Emerg Med. 2015;33(9). doi:10.1016/ j.ajem.2015.06.019.
- Nadeau M-J, Lévesque S, Dion N. Ultrasound-guided regional anesthesia for upper limb surgery. Can J Anaesth. 2013;60(3):304–320. doi:10.1007/s12630-012-9874- 6.
Like what you see? Check out the Complete Book HERE and enter the code: POCUS20 to get a 20% off discount!
If you prefer to buy the book on Amazon, you can click HERE as well.
Ultrasound Case 13: DVT/Thromboembolism (Answer/Explanation)
A. <10%. There are many different ultrasound protocols for lower extremity DVTs:

for lower extremity deep vein thrombosis. 2-CUS (2-region compression ultrasound) indicates compression ultrasound including the femoral veins 1 to 2 cm above and below the saphenofemoral junction and the popliteal veins up to the calf veins confluence; ECUS (extended compression ultrasound), the compression ultrasound from common femoral vein through the popliteal vein up to the calf veins confluence; CCUS (complete compression ultrasound), compression ultrasound from common femoral vein to the ankle; and CDUS (complete duplex ultrasound), compression ultra- sound from the common femoral vein to the ankle (evaluating the posterior tibial and peroneal veins in the calf), color and spectral Doppler of the common femoral (or iliac veins) on both sides, color and spectral Doppler of the popliteal vein on the symptomatic side. CFV = common femoral vein; GSV = greater saphenous vein; FV = femoral vein; POP = popliteal vein; Per = peroneal vein; PTV = posterior tibial vein.
The 2-point exam is a protocol that assesses only the common femoral vein and the popliteal vein. This allows for a relatively fast examination of 2 very commonly affected areas. It was previously thought to be nearly equivalent to whole leg sonography (Bernardi et al. 2008). However, there is now evidence that this will miss a significant amount of DVTs. One retrospective study showed 6.3% of DVTs in the lower extremity would be missed as a result of being located in the femoral vein or deep femoral vein (Zitek et al. 2016). The majority of these cases were located in the femoral vein.
A prospective study using a 2-point compression protocol in the emergency department only had a sensitivity of 57.1% compared to radiology performed ultrasound (Adhikari et al. 2015). The Society of Radiologists in Ultrasound released a consensus statement recommending that in point-of-care DVT evaluations, an extended compression protocol including the deep venous system from the common femoral to the popliteal vein should be used instead of a more limited 2-region compression (Needleman et al. 2018). Ultimately, the point-of-care protocol a practitioner chooses may depend on local practice patterns and the ability for follow-up and repeat comprehensive imaging; however, the evidence shows that extended protocols should increase sensitivity for DVT.
Click HERE to go back to CASE 13
References:
- Adhikari S, Zeger W, Thom C, Fields JM. Isolated deep venous thrombosis: implications for 2-point compression ultrasonography of the lower extremity. Ann Emerg Med. 2015;66(3):262–266.
- Bernardi E, Camporese G, Büller HR, et al. Serial 2-point ultrasonography plus D-dimer vs whole-leg color-coded Doppler ultrasonography for diagnosing suspected symptomatic deep vein thrombosis: a randomized controlled trial. JAMA. 2008;300(14):1653–1659.
- Needleman L, Cronan JJ, Lilly MP, et al. Ultrasound for lower extremity deep venous thrombosis: multidisciplinary recommendations from the Society of Radiologists in Ultrasound Consensus Conference. Circulation. 2018;137(14):1505–1515.
- Zitek T, Baydoun J, Yepez S, Forred W, Slattery D. Mistakes and pitfalls associated with two-point compression ultrasound for deep vein thrombosis. West J Emerg Med. 2016;17(2):201–208.
Like what you see? Check out the Complete Book HERE and enter the code: POCUS20 to get a 20% off discount!
If you prefer to buy the book on Amazon, you can click HERE as well.
Ultrasound Case 14: DVT/Thromboembolism (Answer/Explanation)
A. This is a sign of right heart dysfunction. The ultrasound shows McConnell’s sign.
This sign is defined as a hypokinetic or akinetic right ventricular free wall but with preservation of the function of the apex of the RV This is a sign of poor right ventricular function (choice A). It was originally suggested that this sign was highly specific for PE (McConnell et al. 1996). This was based on the theory that although chronic pulmonary hypertension may cause global RV dysfunction, only an acute increase in RV pressure would manifest with apical sparing. This high specificity was confirmed in several studies, with a meta-analysis showing over specificity of 97% (Fields et al. 2017).
However, subsequently, the specificity of this sign has been questioned. There have been several small studies that showed McConnell’s sign occurs in patients with chronic pulmonary hypertension with similar frequency as in acute PE and that the positive predictive value was only 40% (Walsh and Moore 2015; Vaid et al. 2013), choice B. Additionally, a subsequent study compared the etiologies of those found to have a McConnell’s sign and found that 32% did not have a PE, and many of that group had pulmonary hypertension (Mediratta et al. 2016). Another reason that this sign is not specific for PE is that it can occur in RV infarction.
Casazza et al. (2005) found that this sign seemed to be similarly prevalent in both of these diseases. In their population of patients with both PE and RV infarction, the specificity for PE dropped to 33%. Given the inconsistent available evidence, it can be difficult to know how to view this sign. The specificity for acute PE may increase after RV infarction has been ruled out. However, in this case, the EKG and cardiac markers were not yet available. What is clear is that it does indicate right ventricular dysfunction but may not be able to differentiate between acute and chronic causes of increased right-sided pressures. No studies have suggested that this sign would be specific for chronic pulmonary hypertension (choice D). All of the research does agree that this sign is far from sensitive for acute PE. McConnell’s sign has not been reported in pericarditis, where echocardiographic findings (if any) would include pericardial effusion and pericardial thickening (choice C).
Click HERE to go back to CASE 14
References:
- Casazza F, Bongarzoni A, Capozi A, Agostoni O. Regional right ventricular dysfunction in acute pulmonary embolism and right ventricular infarction. Eur J Echocardiogr. 2005;6(1):11–14.
- Fields JM, Davis J, Girson L, et al. Transthoracic echocardiography for diagnosing pulmonary embolism: a systematic review and metaanalysis. J Am Soc Echocardiogr. 2017;30(7):714–723.
- McConnell MV, Solomon SD, Rayan ME, Come PC, Goldhaber SZ, Lee RT. Regional right ventricular dysfunction detected by echocardiography in acute pulmonary embolism. Am J Cardiol. 1996;78(4):469– 473.
- Mediratta A, Addetia K, Medvedofsky D, Gomberg-Maitland M, MorAvi V, Lang RM. Echocardiographic diagnosis of acute pulmonary embolism in patients with McConnell’s sign. Echocardiography. 2016;33(5):696–702.
- Vaid U, Singer E, Marhefka GD, Kraft WK, Baram M. Poor positive predictive value of McConnell’s sign on transthoracic echocardiography for the diagnosis of acute pulmonary embolism. Hosp Pract. 2013;41(3):23–27.
- Walsh BM, Moore CL. McConnell’s sign is not specific for pulmonary embolism: case report and review of the literature. J Emerg Med. 2015;49(3):301–304.
Like what you see? Check out the Complete Book HERE and enter the code: POCUS20 to get a 20% off discount!
If you prefer to buy the book on Amazon, you can click HERE as well.
Ultrasound Case 15: Bowel (Answer/Explanation)
D. Linear high frequency, transverse. Evaluation of pyloric stenosis should be performed from an anterior approach with the patient in the supine position with a linear, high-frequency transducer in the transverse plane. In general, pediatric applications are best done with the high-frequency linear probe because most important structures are found at a relatively shallow depth. The anterior gastric wall can be traced laterally by starting in the subxiphoid position, using the liver as an acoustic window.
Contiguous with the stomach, the pylorus is usually slightly right of the midline and caudal to the gallbladder. The pylorus will be located between the pyloric antrum and the duodenum. The beginning of the pyloric antrum can be identified with its notched appearance in the gastric wall, known as incisura angularis. Here, even the nonpathologic pyloric muscle will be identified in the long axis with its slightly thickened appearance. The end of the pyloric channel where it meets the duodenum is identified by the curved appearance and abrupt change in thickness of the muscle wall, though the length and shape of the channel is dynamic and can vary with stages of peristalsis (see figure below).

Measurement should be of the thickness of the pylorus muscle, as well as the channel length. Normal values should be ≤ 3 mm and ≤ 14 mm, respectively (see Figure Below).

Learning Point: Evaluation of pyloric stenosis should be performed with the patient in the supine position with a linear, high-frequency probe.
Click HERE to go back to CASE 15
References:
- Fischer JW, Sivitz AB, Abo AW. Pediatric applications. In: Ma OJ, Mateer JR, Reardon RF, Joing SA, eds. Ma and Mateer’s Emergency Ultrasound. 3rd ed. New York, NY: McGraw-Hill; 2014: 587– 630.
- Hernanz-Schulman M. Infantile hypertrophic pyloric stenosis. Radiology. 2003;227(2):319–331.
- Malcom GE 3rd, Raio CC, Del Rios M, Blaivas M, Tsung JW. Feasibility of emergency physician diagnosis of hypertrophic pyloric stenosis using point-of-care ultrasound a multi-center case series. J Emerg Med. 2009;37(3):283–286.
- Noble VE, Nelson BP. Gastrointestinal ultrasound. In: Noble VE, Nelson BP, eds. Manual of Emergency and Critical Care Ultrasound. 2nd ed. Cambridge, UK: Cambridge University Press; 2011:227–240.
Like what you see? Check out the Complete Book HERE and enter the code: POCUS20 to get a 20% off discount!
If you prefer to buy the book on Amazon, you can click HERE as well.
Ultrasound Case 16: Musculoskeletal (Answer/Explanation)
C. 8 mm, curvilinear transducer. The anterior femoral head–neck junction is the most sensitive location to identify a hip joint effusion. A lower frequency curvilinear transducer is typically used to evaluate the hip joint to achieve adequate penetration of the ultrasound beam. The combination of the normal hip joint capsule and physiologic fluid near the femoral head–neck junction typically measures up to 8 mm. This includes the anterior and posterior layers of the hip joint capsule, each measuring up to 3 mm, and up to 2 mm of physiologic hip joint fluid. The joint capsule is hypoechoic on ultrasound and can mimic a joint effusion. As such, a hip joint effusion should not be reported on ultrasound unless the anterior hip joint recess measures greater than 8 mm. Hip aspiration is performed from an anterior approach with the needle tip directed toward the femoral head–neck junction (See Figures Below).

effusion. Longitudinal (Panel (a)) and transverse (Panel (b)) orientation of the ultrasound probe over the anterior hip to evaluate for a hip joint effusion. Notice that the hip is slightly abducted and internally rotated. The longitudinal plane is typically used for hip joint aspiration. The needle is inserted at the caudal aspect of the transducer and directed cranially parallel to the ultrasound probe.

Learning Point: Hip joint effusion is diagnosed when the anterior recess of the hip joint along the femoral neck measures greater than 8 mm.
Click HERE to go back to CASE 16
References:
- Freeman CR, Jones K, Byrd JW. Hip arthroscopy for Legg–CalvePerthes disease: minimum 2-year follow-up. Arthroscopy. 2013;29(4):666– 674.
- Jacobson JA. Hip and thigh ultrasound. In: Jacobson JA, ed.
- Fundamentals of Musculoskeletal Ultrasound. 3rd ed. Philadelphia, PA: Elsevier; 2018:223–283.
- McNally EG. Disorders of the groin and hip anterior. In: McNally EG, ed. Practical Musculoskeletal Ultrasound. 2nd ed. Philadelphia, PA: Elsevier; 2014:193–206.
- Vieira RL, Levy JA. Bedside ultrasonography to identify hip effusions in pediatric patients. Ann Emerg Med. 2010;55(3):284–289.
Like what you see? Check out the Complete Book HERE and enter the code: POCUS20 to get a 20% off discount!
If you prefer to buy the book on Amazon, you can click HERE as well.


hello, i just bought the book on google books. Its great so far but how do I access the videos in the book?